top of page

eduo
visual

Cardiovascular System
Pressure–volume loops
Core Principle of Pressure-Volume Loops
🧷
The pressure-volume loop graphically represents the cardiac cycle by plotting left ventricular pressure (y-axis) against left ventricular volume (x-axis).
🧷
Each complete loop represents one heartbeat, tracing the relationship between pressure and volume through all four phases: filling, isovolumetric contraction, ejection, and isovolumetric relaxation.
🧷
The loop moves counterclockwise, starting at mitral valve opening and ending when the mitral valve opens again.
🧷
Understanding the loop requires recognizing that valve events occur at corners where pressure relationships change — valves open when upstream pressure exceeds downstream pressure.

The Four Phases of the Cardiac Cycle
📍
Phase 1 (Ventricular filling): Mitral valve opens when LV pressure falls below LA pressure → volume increases at low pressure → ends at mitral valve closure.
📍
Phase 2 (Isovolumetric contraction): All valves closed → pressure rises dramatically with no volume change → ends when LV pressure exceeds aortic pressure.
📍
Phase 3 (Ejection): Aortic valve opens → blood ejected into aorta → volume decreases as pressure continues to rise then falls → ends at aortic valve closure.
📍
Phase 4 (Isovolumetric relaxation): All valves closed → pressure falls with no volume change → ends when LV pressure falls below LA pressure.

Key Points on the PV Loop
🔹
Point A: Mitral valve closure — marks end-diastolic volume (EDV) and end-diastolic pressure.
🔹
Point B: Aortic valve opening — marks beginning of ejection at peak isovolumetric pressure.
🔹
Point C: Aortic valve closure — marks end-systolic volume (ESV) and end-systolic pressure.
🔹
Point D: Mitral valve opening — marks beginning of filling when LV pressure equals LA pressure.
🔹
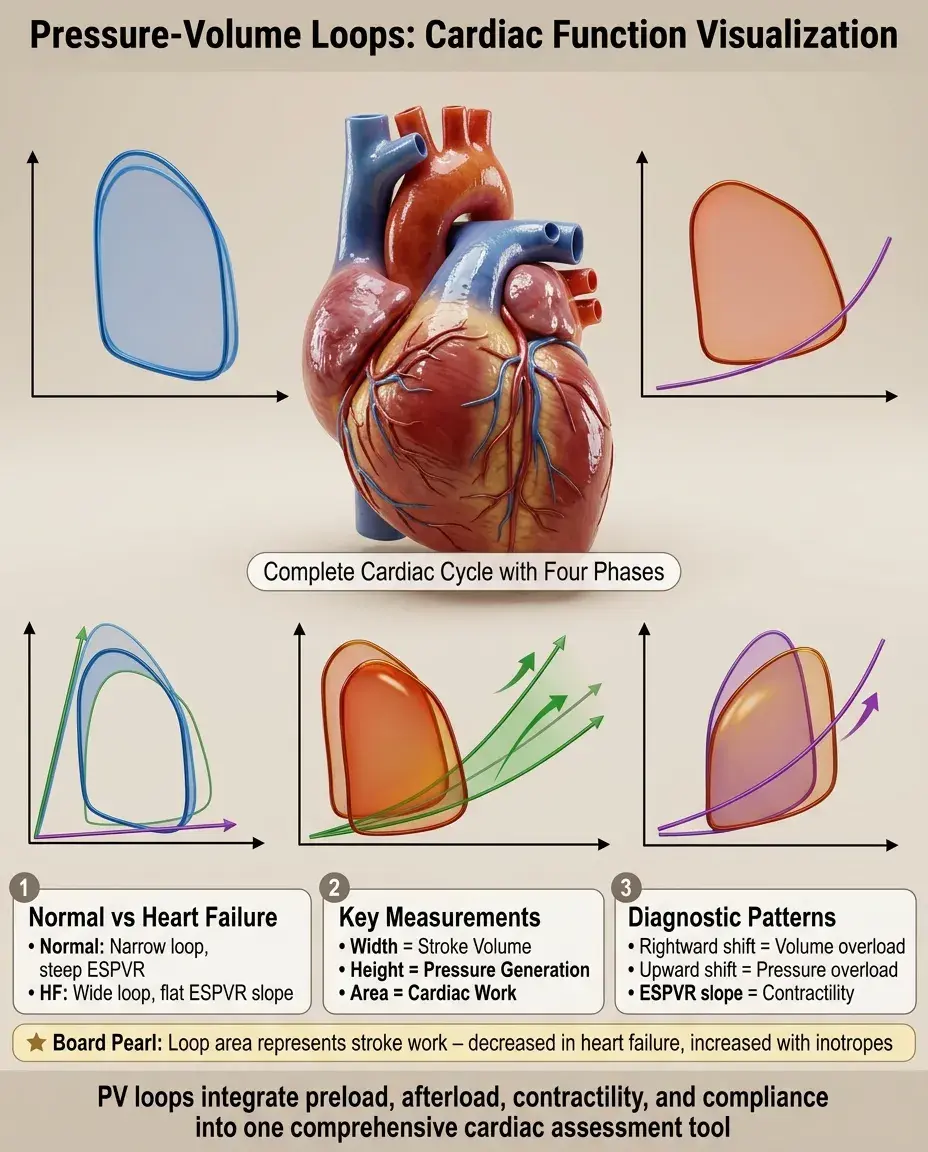
Board pearl: The width of the loop represents stroke volume (EDV − ESV), while the height represents the pressure generation capacity of the ventricle.

Calculating Cardiac Parameters from the Loop
⭐
Stroke volume (SV) = EDV − ESV = width of the loop.
⭐
Ejection fraction (EF) = SV/EDV = (EDV − ESV)/EDV.
⭐
Stroke work = area enclosed by the loop = integral of pressure × volume change.
⭐
The area represents the external work performed by the ventricle against afterload to eject blood.
⭐
Board pearl: A wider loop means higher stroke volume; a taller loop means higher systolic pressure; a larger enclosed area means more cardiac work.

Preload and the PV Loop
✅
Preload is represented by the end-diastolic volume (right edge of the loop).
✅
Increased preload (volume loading, leg raise, increased venous return) shifts the loop rightward → increased EDV → increased stroke volume by the Frank-Starling mechanism.
✅
Decreased preload (dehydration, hemorrhage, venodilation) shifts the loop leftward → decreased EDV → decreased stroke volume.
✅
The end-systolic pressure-volume relationship (ESPVR) line remains unchanged because contractility is constant.
✅
Board pearl: Preload changes move the loop horizontally along the x-axis without changing the slope of ESPVR.

Afterload and the PV Loop
🧠
Afterload is the resistance against which the ventricle ejects — primarily determined by aortic pressure and systemic vascular resistance.
🧠
Increased afterload (hypertension, aortic stenosis) → ventricle must generate higher pressure before aortic valve opens → loop becomes taller and narrower → decreased stroke volume.
🧠
Decreased afterload (vasodilation, hypotension) → aortic valve opens at lower pressure → loop becomes shorter and wider → increased stroke volume.
🧠
The loop shifts up and left along the ESPVR line with increased afterload.
🧠
Board pearl: Afterload changes alter both loop height and width, moving along the ESPVR line.

Contractility and the PV Loop
⚡
Contractility (inotropy) is the intrinsic ability of the myocardium to generate force independent of preload or afterload.
⚡
Increased contractility (sympathetic stimulation, positive inotropes) → steeper ESPVR slope → loop shifts leftward and upward → decreased ESV → increased stroke volume and ejection fraction.
⚡
Decreased contractility (heart failure, negative inotropes) → flatter ESPVR slope → loop shifts rightward and downward → increased ESV → decreased stroke volume and ejection fraction.
⚡
Board pearl: Contractility changes alter the slope of the ESPVR line — the fundamental difference from preload/afterload effects.

The End-Systolic Pressure-Volume Relationship (ESPVR)
📌
ESPVR is the line connecting all possible end-systolic points at different afterloads — it defines the maximum pressure the ventricle can generate at any given volume.
📌
The slope of ESPVR (Ees = end-systolic elastance) is the best load-independent measure of contractility.
📌
Steeper slope = higher contractility; flatter slope = reduced contractility.
📌
The x-intercept (V₀) represents the theoretical volume at which the ventricle can generate no pressure.
📌
Board clue: When shown multiple loops at different afterloads, connect the upper-left corners — this line is the ESPVR.

The End-Diastolic Pressure-Volume Relationship (EDPVR)
📣
EDPVR represents ventricular compliance — the passive filling characteristics of the ventricle.
📣
Normal EDPVR is exponential: at low volumes, small pressure increases allow large volume increases; at high volumes, large pressure increases yield small volume changes.
📣
Decreased compliance (diastolic dysfunction, ventricular hypertrophy, restrictive cardiomyopathy) → steeper EDPVR → higher filling pressures for same volume.
📣
Increased compliance (dilated cardiomyopathy early stage) → flatter EDPVR → lower filling pressures.
📣
Board pearl: The bottom curve of the PV loop follows the EDPVR during passive filling.

Valvular Disease: Aortic Stenosis
🔸
Aortic stenosis increases afterload → ventricle must generate higher pressure to open the stenotic valve.
🔸
Loop changes: taller (higher peak systolic pressure), narrower (reduced stroke volume), rightward shift over time (ventricular remodeling).
🔸
Isovolumetric contraction phase prolonged as more time needed to reach valve-opening pressure.
🔸
Compensatory left ventricular hypertrophy develops → decreased compliance → steeper EDPVR.
🔸
Board pearl: AS produces a characteristic tall, narrow loop with preserved or increased end-diastolic volume.

Valvular Disease: Mitral Regurgitation
🧷
MR allows backward flow during systole → reduced forward stroke volume but increased total stroke volume.
🧷
Loop changes: wider (increased total SV), may be shorter (reduced effective afterload as blood escapes into low-pressure LA).
🧷
End-systolic volume decreases due to dual ejection pathways.
🧷
Chronic MR → volume overload → eccentric hypertrophy → rightward shift of entire loop.
🧷
Board distinction: MR produces a wide loop despite reduced forward flow — total SV includes both forward and regurgitant volumes.

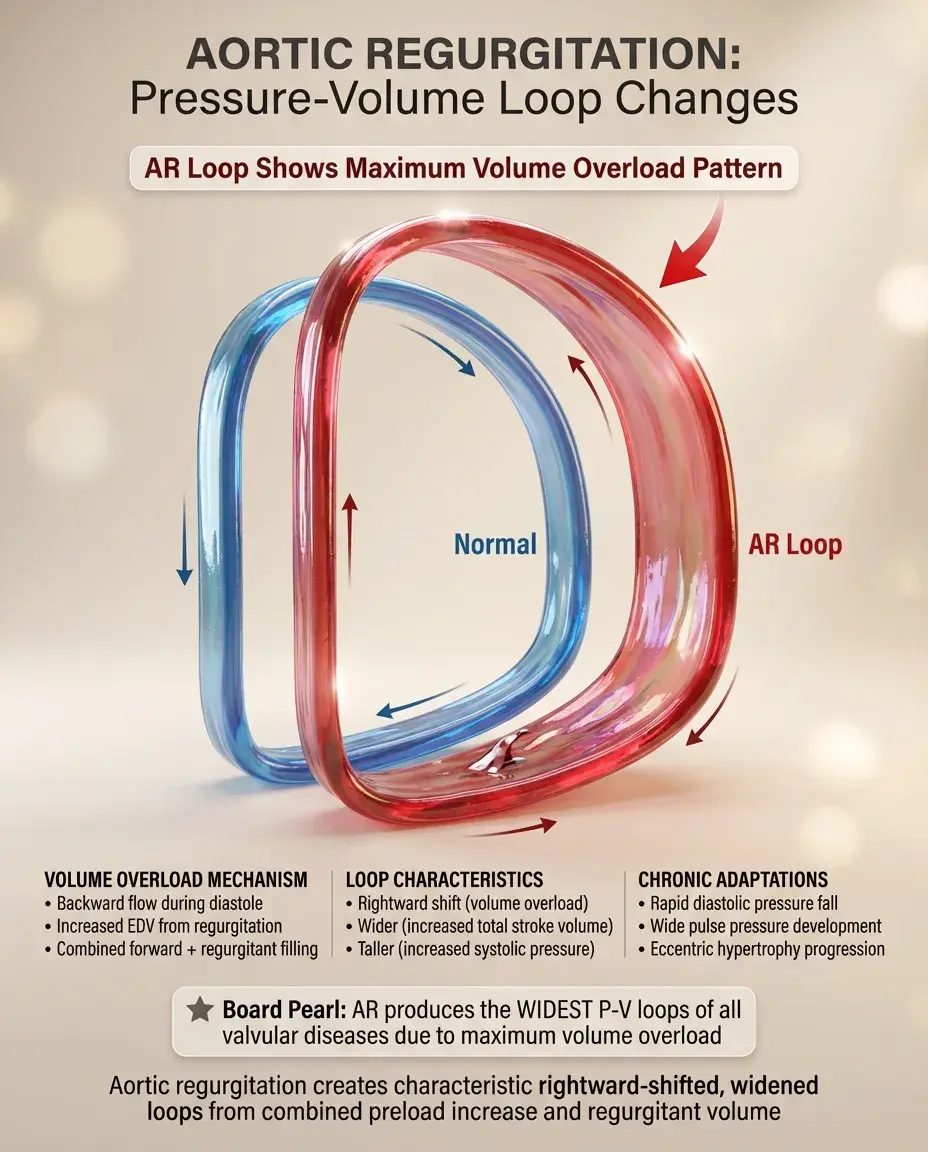
Valvular Disease: Aortic Regurgitation
📍
AR allows backward flow during diastole → increased EDV from combined forward filling and regurgitant volume.
📍
Loop changes: rightward shift (volume overload), wider (increased total SV), taller (increased systolic pressure from increased SV).
📍
Diastolic pressure falls rapidly due to regurgitation → wide pulse pressure.
📍
Chronic AR → eccentric hypertrophy → further rightward shift.
📍
Board pearl: AR produces the widest loops due to maximum volume overload — both increased preload and increased total stroke volume.
Systolic Heart Failure and the PV Loop
🔹
Reduced contractility → flatter ESPVR slope → loop shifts rightward and downward.
🔹
Increased ESV and EDV (rightward shift) → ventricular dilation.
🔹
Reduced stroke volume (narrower loop) → decreased ejection fraction.
🔹
Compensatory mechanisms: increased preload (further rightward shift), sympathetic activation (partial restoration of contractility).
🔹
Board pearl: Systolic HF shows a rightward-shifted, narrow loop with reduced EF — the loop operates on a flatter ESPVR line.

Diastolic Heart Failure and the PV Loop
⭐
Normal ESPVR but steeper EDPVR → impaired relaxation and reduced compliance.
⭐
Loop changes: upward shift (higher filling pressures), reduced EDV (can't fill adequately), preserved ejection fraction.
⭐
Stroke volume reduced due to inadequate filling, not poor contraction.
⭐
Small changes in volume produce large pressure increases → pulmonary congestion at relatively normal LV volumes.
⭐
Board distinction: Diastolic HF has preserved EF with a smaller, upward-shifted loop — the problem is filling, not ejecting.

Exercise and the Normal PV Loop Response
✅
Exercise → sympathetic activation → increased contractility (steeper ESPVR) + increased heart rate.
✅
Increased venous return → increased preload → rightward shift.
✅
Vasodilation in exercising muscles → decreased afterload → wider loop.
✅
Net effect: larger stroke volume, higher cardiac output, more work per beat.
✅
Board pearl: The normal exercise response combines all favorable changes — rightward shift (preload), steeper ESPVR (contractility), and wider loop (reduced afterload).

Positive Inotropes and the PV Loop
🧠
Positive inotropes (dobutamine, milrinone, digoxin) increase contractility → steeper ESPVR slope.
🧠
Loop shifts upward and leftward → decreased ESV → increased stroke volume and ejection fraction.
🧠
Unlike exercise, isolated inotropes don't necessarily change preload or afterload.
🧠
Useful in acute heart failure to improve cardiac output without excessive volume loading.
🧠
Board pearl: Inotropes rotate the loop counterclockwise around the EDV point by decreasing ESV.

Volume Status Assessment Using PV Loops
⚡
Hypovolemia: small, leftward-shifted loop with reduced preload → narrow loop (low SV) operating at steep part of Starling curve.
⚡
Hypervolemia: large, rightward-shifted loop → if on plateau of Starling curve, further volume won't increase SV significantly.
⚡
Fluid responsiveness: if loop operates on ascending limb of Starling curve, volume will increase SV; if on plateau, volume won't help.
⚡
Board application: PV loops can predict whether IV fluids will improve cardiac output in shock states.

Integration with Pressure Tracings
📌
The PV loop correlates with simultaneous pressure tracings and ECG events.
📌
QRS onset → isovolumetric contraction begins (point A).
📌
S1 heart sound → mitral valve closure (point A).
📌
S2 heart sound → aortic valve closure (point C).
📌
Dicrotic notch on arterial tracing → aortic valve closure (point C).
📌
Board integration: Questions may show PV loop alongside ECG or pressure tracings — match the corners to electrical and mechanical events.

Board Question Stem Patterns
📣
Loop shifts right with preserved ESPVR slope → increased preload (volume overload, MR, AR).
📣
Loop becomes taller and narrower → increased afterload (HTN, AS).
📣
ESPVR slope decreases with rightward shift → systolic dysfunction.
📣
Small loop with steep bottom curve → diastolic dysfunction.
📣
Wide loop with normal/increased EF → high-output state or valvular regurgitation.
📣
Loop shifts along a steeper ESPVR → positive inotrope effect.
📣
Multiple loops shown at different afterloads → identify ESPVR by connecting upper-left corners.

One-Line Recap
🔸
The pressure-volume loop visualizes cardiac function through four phases, with width representing stroke volume, height representing pressure generation, area representing work, and key relationships — ESPVR slope indicating contractility, EDPVR curve showing compliance, rightward shifts suggesting volume overload, upward shifts indicating pressure overload — providing a comprehensive framework for understanding normal physiology, exercise responses, heart failure patterns, valvular disease effects, and therapeutic interventions.
bottom of page