top of page

eduo
visual

Biostatistics & Epidemiology
Clinical vs statistical significance
Core Principle of Clinical vs Statistical Significance
🧷
Statistical significance asks: "Is this difference real or due to chance?" Clinical significance asks: "Does this difference matter to patients?"
🧷
A finding can be statistically significant (p < 0.05) yet clinically meaningless if the effect size is too small to impact patient outcomes or change management.
🧷
Conversely, a clinically important effect may fail to reach statistical significance due to small sample size or inadequate power.
🧷
Understanding this distinction is critical for interpreting research findings and applying them to patient care — the foundation of evidence-based medicine.

Statistical Significance: The P-Value Framework
📍
The p-value represents the probability of obtaining results at least as extreme as observed, assuming the null hypothesis is true.
📍
Convention sets α = 0.05 as the threshold: p < 0.05 means we reject the null hypothesis and declare the result "statistically significant."
📍
This is an arbitrary cutoff — p = 0.049 is not meaningfully different from p = 0.051, yet one is "significant" and the other is not.
📍
Board pearl: Statistical significance depends on sample size — with enough subjects, even trivial differences become statistically significant.

Clinical Significance: Effect Size and Meaningful Change
🔹
Clinical significance refers to the practical importance of a treatment effect — whether it makes a real difference in patients' lives.
🔹
Effect size quantifies the magnitude of difference between groups, independent of sample size.
🔹
Common effect size measures: Cohen's d (standardized mean difference), relative risk reduction, absolute risk reduction, and number needed to treat (NNT).
🔹
Board distinction: A blood pressure reduction of 1 mmHg might be statistically significant in a large trial but is clinically meaningless; a 10 mmHg reduction is both statistically and clinically significant.

The Role of Sample Size in Statistical Significance
⭐
Larger samples have greater power to detect small differences → increased likelihood of finding statistical significance.
⭐
The standard error of the mean decreases as sample size increases: SE = σ/√n.
⭐
With massive samples (n > 10,000), even trivial differences like 0.1 mmHg blood pressure or 0.01% change in mortality can achieve p < 0.05.
⭐
This creates the "large sample paradox" — statistically significant results that have no clinical relevance.
⭐
Board pearl: When evaluating mega-trials, always check the actual effect size, not just the p-value.

Confidence Intervals: Beyond the P-Value
✅
The 95% confidence interval provides a range of plausible values for the true effect size, offering more information than a p-value alone.
✅
If the CI includes the null value (0 for differences, 1 for ratios), the result is not statistically significant.
✅
Wide confidence intervals indicate uncertainty about the true effect size, even if p < 0.05.
✅
Narrow CIs that exclude clinically meaningful values suggest the finding, while statistically significant, may not be clinically important.
✅
Example: Risk ratio 0.97 (95% CI 0.96–0.98, p = 0.001) — statistically significant but clinically trivial 3% reduction.

Number Needed to Treat (NNT) as a Clinical Significance Metric
🧠
NNT = 1/ARR, where ARR is the absolute risk reduction.
🧠
NNT represents how many patients must be treated to prevent one adverse outcome — a practical measure of clinical impact.
🧠
Lower NNT indicates greater clinical significance: NNT = 5 is highly meaningful, NNT = 100 is marginally useful, NNT = 1000 is clinically insignificant.
🧠
Board pearl: A drug reducing mortality from 2% to 1% has RRR = 50% (sounds impressive) but ARR = 1% and NNT = 100 (less impressive).
🧠
Always consider NNT alongside cost, side effects, and patient burden when evaluating clinical significance.

Minimal Clinically Important Difference (MCID)
⚡
MCID is the smallest change in an outcome measure that patients perceive as beneficial and that would mandate a change in management.
⚡
Established through patient surveys, expert consensus, or distribution-based methods.
⚡
Examples: 2-point change on a 10-point pain scale, 10% improvement in FEV₁ for asthma, 50-meter increase in 6-minute walk distance.
⚡
Studies should be designed with sufficient power to detect the MCID, not just any statistically significant difference.
⚡
Board clue: If a trial shows statistical significance but the effect size is below the established MCID, the finding lacks clinical relevance.

Type I Error and Multiple Comparisons Problem
📌
Type I error (α) is the probability of incorrectly rejecting a true null hypothesis — finding significance where none exists.
📌
With multiple comparisons, the chance of at least one false positive increases: family-wise error rate = 1 − (1 − α)ⁿ.
📌
Testing 20 independent hypotheses at α = 0.05 gives a 64% chance of at least one spurious significant result.
📌
Correction methods (Bonferroni, false discovery rate) reduce Type I error but may miss true effects.
📌
Board pearl: Subgroup analyses and secondary outcomes are prone to false positives — treat "surprising" findings with skepticism.

Statistical Power and Type II Error
📣
Power = 1 − β, where β is the Type II error rate (failing to detect a true effect).
📣
Conventional target is 80% power, meaning 20% chance of missing a real difference.
📣
Power depends on: effect size (larger effects easier to detect), sample size (more subjects → more power), significance level (α), and variance.
📣
Underpowered studies may miss clinically important effects, leading to false negative conclusions.
📣
Board distinction: "No significant difference" ≠ "no difference" — it may mean the study lacked power to detect a real effect.

Surrogate Endpoints vs Clinical Outcomes
🔸
Surrogate endpoints are biomarkers assumed to predict clinical benefit: LDL for cardiovascular events, HbA1c for diabetic complications, tumor size for survival.
🔸
Statistical significance in surrogate outcomes doesn't guarantee clinical significance in patient-centered outcomes.
🔸
Classic failures: drugs that lower HbA1c but increase mortality, antiarrhythmics that suppress PVCs but increase sudden death.
🔸
Board pearl: FDA approval based on surrogate endpoints requires post-marketing studies to confirm clinical benefit.
🔸
Always prioritize hard clinical endpoints (mortality, morbidity, quality of life) over surrogate markers.

The Fragility Index
🧷
The fragility index is the minimum number of patients whose status would need to change from non-event to event to make a statistically significant result non-significant.
🧷
A fragility index of 1 means changing a single patient's outcome eliminates statistical significance — extremely fragile.
🧷
Many landmark trials have fragility indices < 10, highlighting how tenuous some "significant" findings are.
🧷
Particularly relevant for trials stopped early for benefit, which may overestimate treatment effects.
🧷
Board insight: Large trials with small p-values near 0.05 often have low fragility indices despite seeming robust.

Clinical Significance in Diagnostic Test Evaluation
📍
A diagnostically significant test substantially changes pre-test to post-test probability, altering clinical management.
📍
Likelihood ratios > 10 or < 0.1 represent strong diagnostic significance; LRs between 0.5 and 2 rarely change management.
📍
Statistical measures (sensitivity, specificity) must translate to clinical utility through predictive values in the relevant population.
📍
Example: A highly sensitive D-dimer is statistically excellent but clinically limited by poor specificity in hospitalized patients.
📍
Board pearl: The clinical value of a test depends on prevalence — the same test performs differently in screening vs referral populations.

Publication Bias and the File Drawer Problem
🔹
Studies showing statistical significance are more likely to be published than null results — publication bias.
🔹
This creates a literature skewed toward positive findings, overestimating true effect sizes.
🔹
Meta-analyses may show statistical significance by combining published studies while missing unpublished null results.
🔹
Funnel plots and statistical tests can detect publication bias but cannot fully correct for it.
🔹
Board clue: Industry-sponsored trials showing marginal statistical significance (p = 0.04) should raise suspicion of selective reporting.

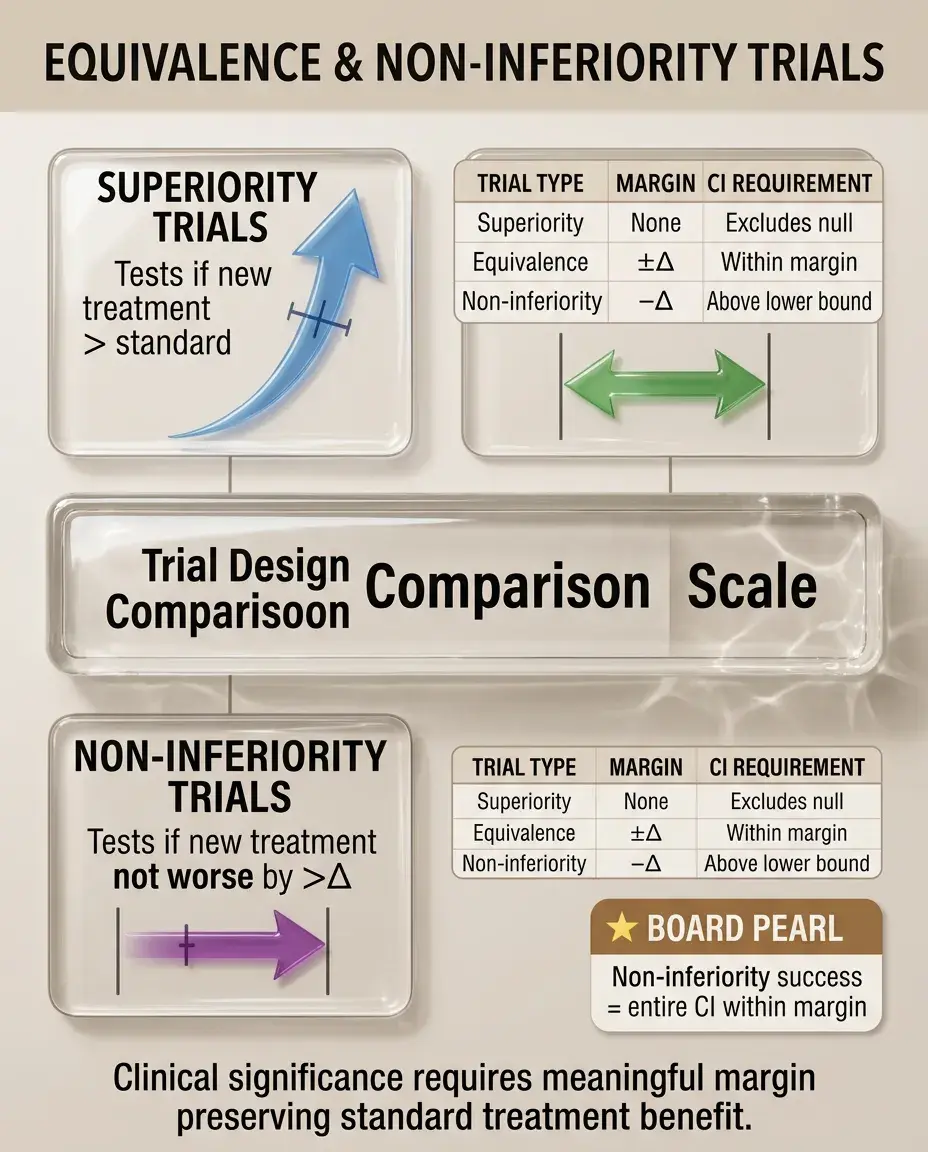
Equivalence and Non-Inferiority Trials
⭐
Traditional trials test for superiority; equivalence trials test whether treatments are similar within a pre-specified margin.
⭐
Non-inferiority trials test whether a new treatment is not worse than standard by more than a predetermined margin (Δ).
⭐
The margin Δ must be clinically justified — statistical non-inferiority within an overly generous margin lacks clinical meaning.
⭐
Board pearl: In non-inferiority trials, the confidence interval must lie entirely within the non-inferiority margin to claim success.
⭐
Clinical significance depends on whether the margin preserves a meaningful portion of the standard treatment's benefit.
Cost-Effectiveness and Clinical Significance
✅
A treatment can be statistically and clinically effective yet not cost-effective if the benefit doesn't justify the expense.
✅
Quality-adjusted life years (QALYs) integrate both quantity and quality of life benefits.
✅
Incremental cost-effectiveness ratio (ICER) = (Cost_new − Cost_standard)/(QALY_new − QALY_standard).
✅
Thresholds vary by healthcare system: ~$50,000–100,000/QALY in the US.
✅
Board insight: Expensive treatments with marginal clinical benefits (NNT > 100) often fail cost-effectiveness analysis despite statistical significance.

Composite Endpoints and Clinical Interpretation
🧠
Composite endpoints combine multiple outcomes (death, MI, stroke, revascularization) to increase event rates and statistical power.
🧠
Statistical significance in composites may be driven by less important components while missing effects on mortality.
🧠
Components should have similar clinical importance and treatment effects — mixing death with symptom relief is problematic.
🧠
Board pearl: Always examine individual components — a composite driven by revascularization rather than death/MI has different clinical implications.
🧠
Regulatory agencies increasingly require hierarchical testing of components.

Real-World Effectiveness vs Efficacy
⚡
Efficacy (controlled trial setting) may not translate to effectiveness (real-world practice) even with statistical significance.
⚡
Trial populations are often younger, healthier, and more adherent than typical patients.
⚡
Protocol-mandated monitoring and follow-up inflate treatment benefits compared to routine care.
⚡
Example: A heart failure drug showing 20% mortality reduction in trials may show 5–10% benefit in registries.
⚡
Board distinction: Pragmatic trials designed to mirror clinical practice provide better estimates of real-world clinical significance.

Patient-Reported Outcomes and Clinical Meaning
📌
Statistical improvements in patient-reported outcomes (PROs) must exceed thresholds meaningful to patients.
📌
Different stakeholders define clinical significance differently: patients value symptom relief, physicians value objective measures, payers value cost-effectiveness.
📌
Response rates (proportion achieving MCID) are more clinically interpretable than mean changes.
📌
Board clue: A statistically significant 0.5-point improvement on a 100-point quality of life scale is clinically meaningless.
📌
Anchor-based methods linking PRO changes to global ratings establish clinical significance thresholds.

Board Question Stem Patterns
📣
Large RCT with p = 0.04 but 95% CI includes clinically trivial values → statistically significant but not clinically significant.
📣
Small pilot study with p = 0.08 but large effect size → not statistically significant but potentially clinically important, needs larger trial.
📣
Meta-analysis of 50,000 patients shows RR 0.98 (p < 0.001) → statistically significant but clinically meaningless.
📣
Drug reduces surrogate marker with p < 0.001 but no mortality benefit → statistical without clinical significance.
📣
NNT = 250 with significant side effects → statistically significant but unfavorable benefit-risk ratio.
📣
Wide confidence interval crossing 1.0 → neither statistically nor clinically significant.
📣
Fragility index = 2 in a major trial → statistically fragile result despite significance.

One-Line Recap
🔸
Clinical significance requires meaningful effect sizes that change patient outcomes or management decisions, while statistical significance merely indicates the observed difference is unlikely due to chance — with large samples producing significant p-values for trivial effects, making measures like NNT, MCID, confidence intervals, and fragility indices essential for determining whether research findings matter in practice.

bottom of page