top of page

eduo
visual

Biostatistics & Epidemiology
Clinical relevance vs statistical significance
Core Principle of Clinical vs Statistical Significance
🧷
Statistical significance answers: "Is this finding likely due to chance?" Clinical significance answers: "Does this finding matter to patient care?"
🧷
A p-value < 0.05 means there's less than 5% probability the observed difference occurred by chance alone — but says nothing about whether the difference is large enough to change clinical practice.
🧷
Clinical significance requires both a meaningful effect size and consideration of risks, benefits, costs, and patient values.
🧷
Board pearl: A study can be statistically significant but clinically irrelevant (huge sample detects tiny differences) or clinically important but not statistically significant (small sample misses real effects).

The P-Value and Its Limitations
📍
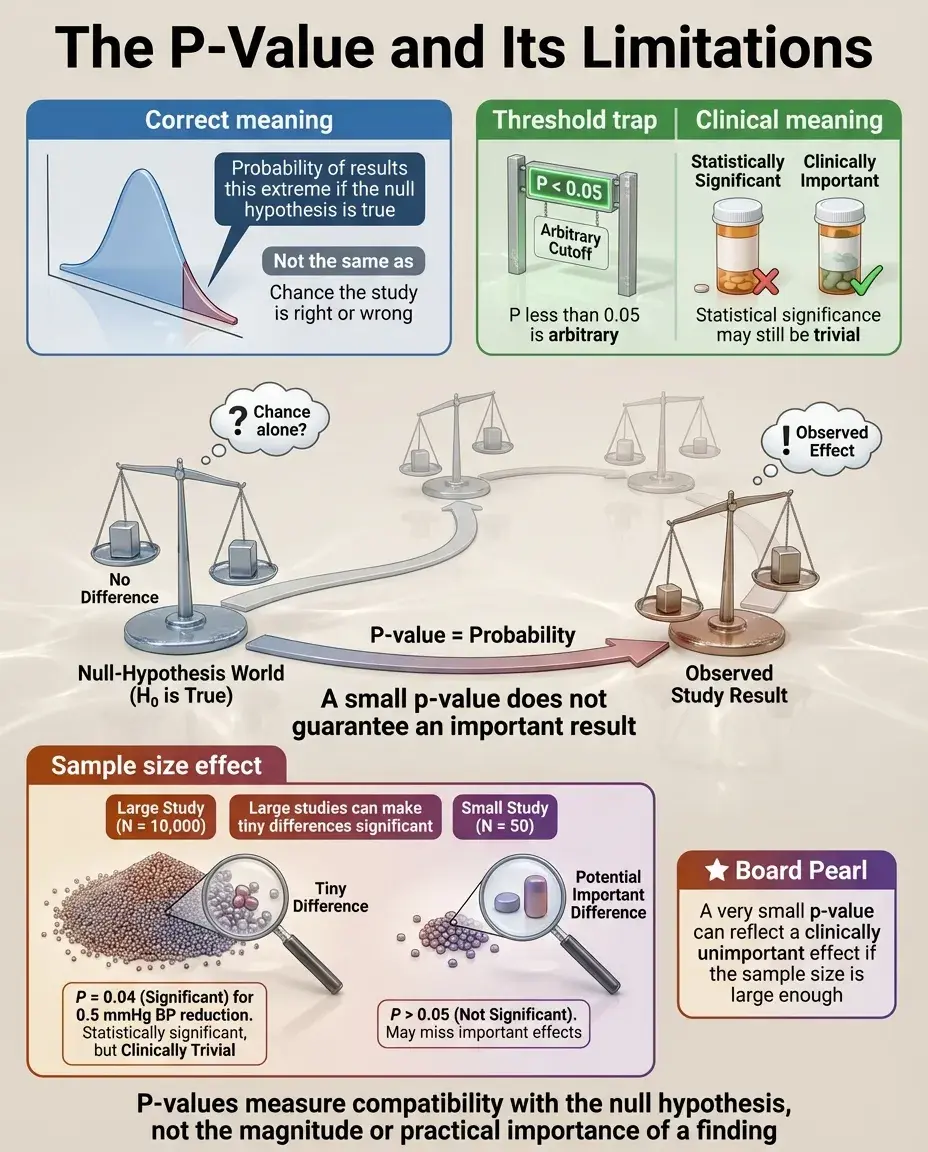
The p-value represents the probability of observing results at least as extreme as those found, assuming the null hypothesis is true.
📍
P < 0.05 is an arbitrary threshold — it doesn't mean there's a 95% chance the alternative hypothesis is true or a 5% chance the results are wrong.
📍
P-values depend heavily on sample size: with large N, trivial differences become "significant"; with small N, important differences may be missed.
📍
Board pearl: If a question states "p = 0.04" for a blood pressure reduction of 0.5 mmHg in 10,000 patients, recognize this as statistically significant but clinically meaningless.
Effect Size: Quantifying the Magnitude of Difference
🔹
Effect size measures how large a difference or association is, independent of sample size — examples include mean difference, relative risk, odds ratio, number needed to treat (NNT), and Cohen's d.
🔹
Small effect sizes can be statistically significant with large samples; large effect sizes can be non-significant with small samples.
🔹
Confidence intervals provide both statistical significance (if they exclude the null value) and clinical significance (by showing the range of plausible effect sizes).
🔹
Board distinction: A 95% CI for risk difference of 0.001 to 0.003 suggests statistical significance but negligible clinical impact.

Number Needed to Treat (NNT) and Clinical Relevance
⭐
NNT = 1/ARR (absolute risk reduction) — represents how many patients must receive treatment for one to benefit.
⭐
Lower NNT indicates greater clinical significance: NNT of 5 is more impressive than NNT of 100.
⭐
NNT provides concrete clinical context: treating 100 patients to prevent one outcome may not justify side effects or costs.
⭐
Example: A statin reducing MI risk from 2% to 1% has ARR = 1% and NNT = 100 — statistically significant but requires treating 100 patients to prevent one MI.
⭐
Board pearl: When comparing interventions, always consider NNT alongside statistical significance.

Statistical Power and Type II Error
✅
Power is the probability of detecting a true difference when it exists (1 − β, where β is Type II error rate).
✅
Underpowered studies may fail to detect clinically important differences, leading to false negative conclusions.
✅
Power depends on: effect size (larger effects easier to detect), sample size (more participants → more power), significance level (α), and variability in the data.
✅
Board clue: "The study found no significant difference" in a small trial doesn't mean no difference exists — it may simply lack power to detect it.

Multiple Comparisons and the Problem of P-Hacking
🧠
Testing multiple hypotheses increases the chance of finding at least one "significant" result by chance alone.
🧠
With 20 comparisons at α = 0.05, there's a 64% probability of at least one false positive finding.
🧠
Corrections like Bonferroni adjustment (dividing α by number of comparisons) reduce Type I error but increase Type II error.
🧠
Board pearl: Be skeptical of studies reporting many outcomes where only one or two reach significance — likely represents chance findings rather than true effects.

Clinical Significance in Diagnostic Tests
⚡
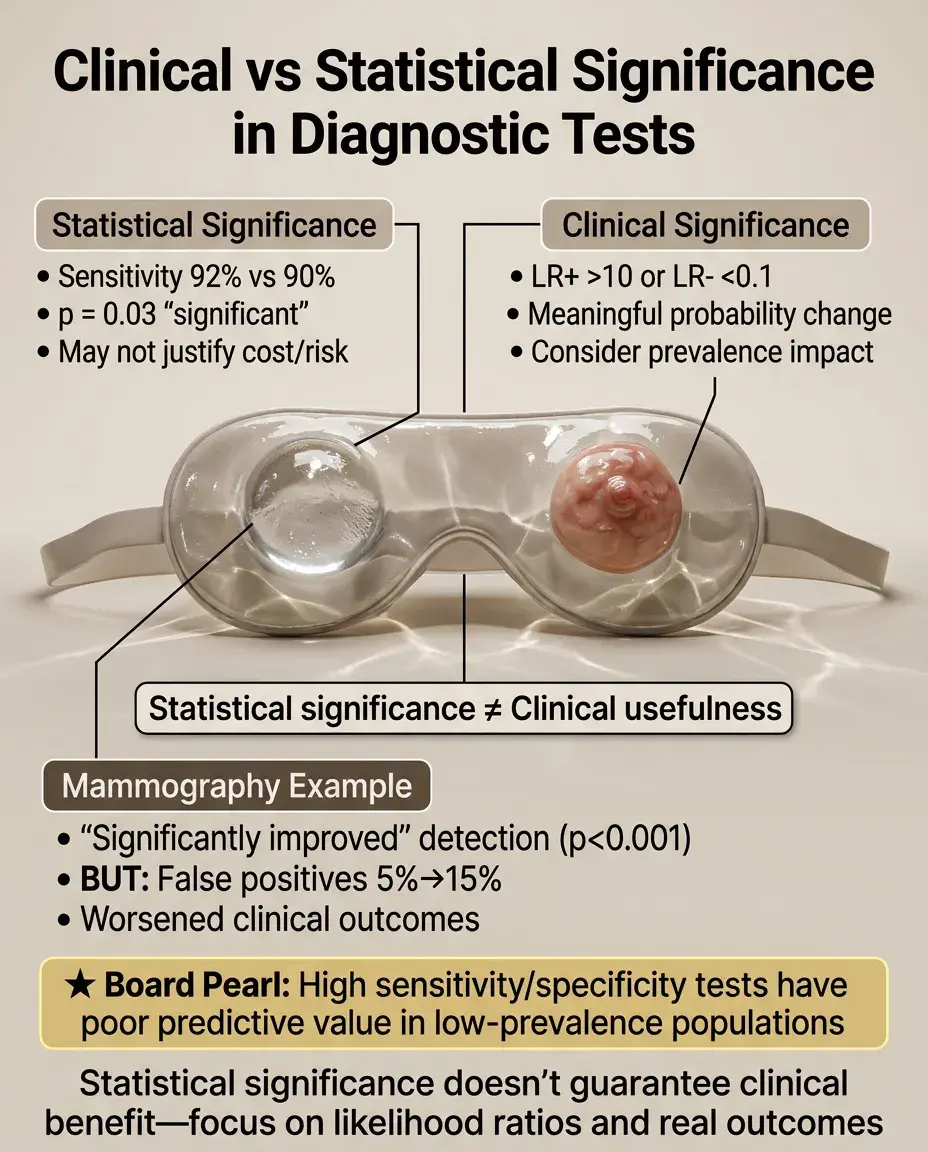
A statistically significant difference in test sensitivity (e.g., 92% vs 90%, p = 0.03) may not justify switching to a more expensive or invasive test.
⚡
Likelihood ratios translate test results into clinically meaningful probability changes: LR+ > 10 or LR− < 0.1 represent clinically useful tests.
⚡
Consider prevalence: even highly sensitive/specific tests have poor predictive value in low-prevalence populations.
⚡
Board distinction: A mammography study showing "significantly improved" detection (p < 0.001) but increasing false positives from 5% to 15% may worsen clinical outcomes.
Sample Size and Its Double-Edged Sword
📌
Large samples detect tiny, clinically irrelevant differences as "statistically significant" — a curse of big data.
📌
Small samples miss important differences due to insufficient power — the traditional limitation of pilot studies.
📌
Optimal sample size balances statistical power with feasibility and clinical relevance of detectable effects.
📌
Example: A study of 50,000 patients finds vitamin C reduces cold duration by 2 hours (p = 0.001) — statistically robust but clinically trivial.
📌
Board pearl: Always examine actual effect sizes, not just p-values, especially in large database studies.

Confidence Intervals: Bridging Statistical and Clinical Significance
📣
Confidence intervals provide a range of plausible values for the true effect, incorporating both statistical uncertainty and effect magnitude.
📣
A 95% CI excluding the null value (e.g., RR = 1.0) indicates statistical significance.
📣
Wide CIs suggest imprecise estimates; narrow CIs suggest precise estimates.
📣
Clinical interpretation: If the entire CI represents clinically important effects → pursue intervention. If the CI includes clinically trivial effects → reconsider.
📣
Example: Blood pressure medication with 95% CI for SBP reduction of 0.5–1.5 mmHg is statistically significant but clinically questionable.

The Minimal Clinically Important Difference (MCID)
🔸
MCID is the smallest change in an outcome that patients or clinicians consider meaningful — established through patient surveys, expert consensus, or distribution-based methods.
🔸
Statistical analyses should be powered to detect the MCID, not just any difference.
🔸
Example: In pain scales (0–10), MCID is typically 1–2 points. A drug reducing pain by 0.3 points (p = 0.02) is statistically significant but below MCID.
🔸
Board pearl: Questions about study design often ask about powering studies to detect "clinically meaningful" differences — this refers to MCID, not just statistical significance.

Surrogate Endpoints vs Clinical Outcomes
🧷
Surrogate endpoints (lab values, imaging findings) may show statistical improvement without clinical benefit.
🧷
Example: A drug significantly lowering HbA1c (p < 0.001) may not reduce cardiovascular events or mortality — the outcomes patients actually care about.
🧷
FDA drug approvals based on surrogate endpoints require post-market studies to confirm clinical benefit.
🧷
Board distinction: Recognize when studies report surrogate outcomes (LDL reduction, tumor shrinkage, viral load) versus patient-centered outcomes (mortality, quality of life, functional status).

Subgroup Analyses and Clinical Heterogeneity
📍
Subgroup analyses examine whether treatment effects differ across patient characteristics — often generating statistically significant but spurious findings.
📍
Pre-specified subgroup analyses with biological plausibility carry more weight than post-hoc "data dredging."
📍
Even real subgroup effects may lack clinical significance if they don't change treatment decisions.
📍
Board pearl: Be skeptical of studies claiming benefit only in oddly specific subgroups (e.g., "women aged 45–50 with BMI 27–29") — likely represents multiple testing artifacts.

Publication Bias and the File Drawer Problem
🔹
Studies with statistically significant results are more likely to be published than null findings, distorting the literature.
🔹
This bias inflates apparent effect sizes and clinical importance of interventions.
🔹
Meta-analyses attempt to address this through funnel plots and statistical tests for publication bias.
🔹
Clinical relevance: Published studies may overestimate treatment benefits — the true effect is often smaller than the literature suggests.
🔹
Board clue: When interpreting systematic reviews, look for mention of publication bias assessment.

Statistical Significance in Equivalence and Non-Inferiority Trials
⭐
Traditional hypothesis testing asks if treatments differ; equivalence/non-inferiority trials ask if treatments are similar enough.
⭐
Non-inferiority margin defines the maximum acceptable difference — must be clinically justified, not just statistically convenient.
⭐
A generic drug proving non-inferiority with margin of 10% may be statistically successful but clinically concerning if 10% worse efficacy matters.
⭐
Board pearl: Non-inferiority doesn't mean equal effectiveness — it means not worse by more than a pre-specified, clinically acceptable margin.

Real-World Effectiveness vs Randomized Trial Efficacy
✅
RCTs demonstrate efficacy under ideal conditions with selected patients; real-world effectiveness is often lower.
✅
A drug showing 30% risk reduction in an RCT (p < 0.001) may show only 10% reduction in clinical practice due to non-adherence, comorbidities, and less intensive monitoring.
✅
Pragmatic trials attempt to bridge this gap by testing interventions under real-world conditions.
✅
Board distinction: Efficacy (can it work?) differs from effectiveness (does it work in practice?) — both matter for clinical decision-making.

Cost-Effectiveness and Resource Allocation
🧠
An intervention can be statistically and clinically significant but still not worth implementing due to cost.
🧠
Quality-adjusted life years (QALYs) and incremental cost-effectiveness ratios (ICERs) quantify value in healthcare.
🧠
Typical threshold: $50,000–100,000 per QALY gained is considered cost-effective in developed countries.
🧠
Example: A cancer drug extending life by 2 months (p < 0.001) at $200,000 may be statistically/clinically significant but not cost-effective.
🧠
Board relevance: Recognize that clinical guidelines increasingly incorporate cost-effectiveness alongside clinical benefit.

Patient-Reported Outcomes and Clinical Meaning
⚡
Statistical improvements in physician-measured outcomes may not translate to patient-perceived benefit.
⚡
Quality of life scores, functional assessments, and symptom scales require different interpretation than laboratory values.
⚡
A statistically significant 3-point improvement on a 100-point quality of life scale is unlikely to be patient-noticeable.
⚡
Board pearl: When evaluating interventions for chronic diseases, prioritize patient-reported outcomes over surrogate markers — what matters is how patients feel and function.

Time-to-Event Analyses and Clinical Impact
📌
Hazard ratios from survival analyses can be statistically significant but represent minimal absolute benefit.
📌
Median survival improvement of 2 weeks (HR = 0.85, p = 0.03) may not justify toxic chemotherapy.
📌
Number needed to treat varies over time — early separation of curves indicates greater clinical impact.
📌
Board clue: Always examine absolute risk reduction and median survival differences, not just hazard ratios and p-values, when interpreting oncology trials.

Board Question Stem Patterns
📣
Large study finds p = 0.02 for 0.5 mmHg blood pressure difference → statistically significant but clinically trivial.
📣
Small pilot study shows 20% mortality reduction but p = 0.08 → clinically important but underpowered.
📣
NNT = 250 for expensive intervention → question cost-effectiveness despite statistical significance.
📣
Surrogate endpoint improves without clinical outcome benefit → caution about assuming patient benefit.
📣
Multiple subgroup analyses with one positive finding → likely false positive from multiple testing.
📣
Wide confidence interval crossing null but including large effects → insufficient evidence, not evidence of no effect.

One-Line Recap
🔸
Statistical significance (p < 0.05) indicates findings unlikely due to chance but reveals nothing about clinical importance — which requires meaningful effect sizes, consideration of NNT, patient-centered outcomes over surrogates, cost-effectiveness, and recognition that large samples find trivial differences while small samples miss important ones.

bottom of page