top of page

eduo
visual

Cardiovascular System
Cardiac cycle phases (isovolumetric contraction/relaxation, ejection, filling)
Core Principle of the Cardiac Cycle
🧷
The cardiac cycle represents the sequence of mechanical and electrical events that occur with each heartbeat, lasting approximately 0.8 seconds at rest (heart rate 75 bpm).
🧷
The cycle is fundamentally divided into two periods: systole (ventricular contraction and ejection) and diastole (ventricular relaxation and filling).
🧷
Four distinct phases occur: isovolumetric contraction, ventricular ejection, isovolumetric relaxation, and ventricular filling.
🧷
Each phase is characterized by specific pressure relationships between the atria, ventricles, and great vessels that determine valve opening/closing and blood flow direction.
🧷
Board pearl: The cardiac cycle is best understood by tracking pressure changes — valves open when upstream pressure exceeds downstream pressure.

Phase 1: Isovolumetric Contraction
📍
Begins with mitral valve closure (S1) when left ventricular pressure exceeds left atrial pressure at the start of systole.
📍
All four valves are closed, creating a sealed chamber — hence "isovolumetric" (constant volume).
📍
Ventricular pressure rises rapidly as the myocardium contracts against a fixed blood volume.
📍
Duration: approximately 50 milliseconds, ending when ventricular pressure exceeds aortic pressure (80 mmHg) and the aortic valve opens.
📍
Board pearl: This is the only systolic phase where no blood moves — pressure increases but volume remains constant.

Phase 2: Ventricular Ejection
🔹
Begins when ventricular pressure exceeds aortic pressure, forcing the aortic valve open.
🔹
Divided into rapid ejection (first two-thirds) when most stroke volume is expelled, and reduced ejection (final third) as contraction weakens.
🔹
Peak ventricular and aortic pressures occur during rapid ejection (approximately 120 mmHg in the left ventricle).
🔹
Ejection ends when ventricular pressure falls below aortic pressure, causing aortic valve closure (S2).
🔹
Stroke volume (SV) = End-diastolic volume (EDV) − End-systolic volume (ESV), typically 70 mL at rest.
🔹
Board clue: Ejection fraction = SV/EDV × 100%, normally ≥55%.

Phase 3: Isovolumetric Relaxation
⭐
Begins with aortic valve closure (S2) when ventricular pressure drops below aortic pressure.
⭐
All four valves are again closed — the second isovolumetric phase.
⭐
Ventricular pressure falls rapidly as the myocardium relaxes, but volume remains constant.
⭐
Duration: approximately 80 milliseconds, ending when ventricular pressure falls below atrial pressure and the mitral valve opens.
⭐
This phase represents the transition from systole to diastole.
⭐
Board pearl: Both isovolumetric phases have all valves closed — the key distinguisher is rising vs. falling pressure.

Phase 4: Ventricular Filling
✅
Begins when ventricular pressure falls below atrial pressure, opening the AV valves.
✅
Consists of three sub-phases: rapid filling (first third of diastole, 80% of filling), diastasis (middle third, minimal flow), and atrial systole (final third, 20% of filling).
✅
Rapid filling may produce S3 if ventricular compliance is decreased.
✅
Atrial contraction provides the "atrial kick," contributing 20% of ventricular filling at rest but up to 40% during tachycardia.
✅
S4 occurs during atrial systole when the atrium contracts against a stiff ventricle.
✅
Board distinction: Loss of atrial kick in atrial fibrillation reduces cardiac output by 20–30%.

Pressure-Volume Loop Basics
🧠
The pressure-volume loop graphically represents the cardiac cycle with volume on the x-axis and pressure on the y-axis.
🧠
The loop proceeds counterclockwise through four corners: mitral valve closure → aortic valve opening → aortic valve closure → mitral valve opening.
🧠
Width of the loop = stroke volume; area within the loop = stroke work.
🧠
The end-systolic pressure-volume relationship (ESPVR) represents contractility — leftward shift indicates increased contractility.
🧠
The end-diastolic pressure-volume relationship (EDPVR) represents ventricular compliance — rightward shift indicates decreased compliance.
🧠
Board pearl: Loop shifts right with volume overload, up with pressure overload.

Valve Timing and Heart Sounds
⚡
S1 marks the beginning of systole: mitral valve closure slightly precedes tricuspid closure (M1-T1 split).
⚡
S2 marks the beginning of diastole: aortic valve closure slightly precedes pulmonic closure (A2-P2 split).
⚡
Physiologic splitting of S2 widens with inspiration due to increased venous return delaying pulmonic valve closure.
⚡
AV valves close when ventricular pressure exceeds atrial pressure; semilunar valves close when arterial pressure exceeds ventricular pressure.
⚡
Board distinction: Fixed splitting of S2 → ASD; paradoxical splitting → LBBB or severe AS; wide splitting → RBBB or pulmonary stenosis.

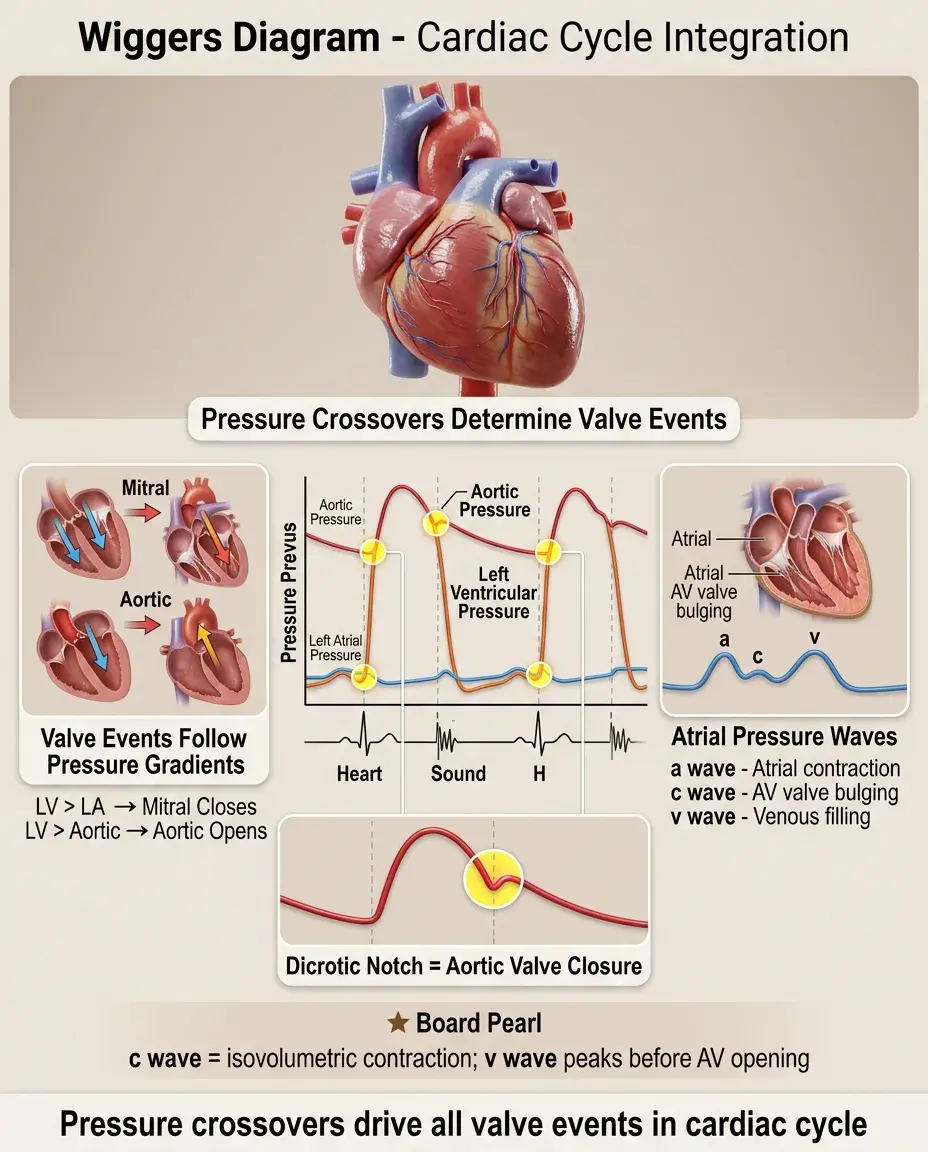
The Wiggers Diagram
📌
The Wiggers diagram superimposes pressure tracings from the left atrium, left ventricle, and aorta with ECG and heart sounds over time.
📌
Key pressure crossover points determine valve events: LV pressure crossing LA pressure → mitral valve closure; LV pressure crossing aortic pressure → aortic valve opening.
📌
The dicrotic notch on the aortic pressure tracing represents aortic valve closure and the beginning of isovolumetric relaxation.
📌
Atrial pressure shows three waves: a wave (atrial contraction), c wave (ventricular contraction bulging AV valves), v wave (venous filling during systole).
📌
Board pearl: The c wave coincides with isovolumetric contraction; the v wave peaks just before AV valve opening.
Right vs. Left Heart Timing
📣
Right heart events occur slightly after left heart events due to lower pressures requiring less time to exceed.
📣
Tricuspid closure follows mitral closure by 0.04 seconds; pulmonic closure follows aortic closure by 0.06 seconds during expiration.
📣
Right ventricular systolic pressure (25 mmHg) is approximately one-fifth of left ventricular pressure.
📣
Pulmonary artery diastolic pressure (10 mmHg) approximates left atrial pressure in the absence of lung disease.
📣
Board clue: Inspiration increases venous return to the right heart, delaying pulmonic valve closure and widening the S2 split — this is normal physiologic splitting.

Coronary Perfusion Timing
🔸
Left coronary perfusion occurs primarily during diastole when aortic diastolic pressure exceeds left ventricular pressure.
🔸
During systole, contracting myocardium compresses intramyocardial vessels, impeding left coronary flow.
🔸
Right coronary perfusion occurs throughout the cardiac cycle due to lower right ventricular pressures.
🔸
Coronary perfusion pressure = Aortic diastolic pressure − Left ventricular end-diastolic pressure (LVEDP).
🔸
Board pearl: Tachycardia reduces coronary perfusion time by shortening diastole disproportionately; bradycardia improves coronary perfusion by prolonging diastole.

Preload and the Frank-Starling Mechanism
🧷
Preload is the ventricular wall stress at end-diastole, clinically approximated by end-diastolic volume or pressure.
🧷
The Frank-Starling law states that increased preload leads to increased stroke volume through optimal sarcomere length-tension relationships.
🧷
Venous return determines preload: increased by volume infusion, leg elevation, or sympathetic venoconstriction; decreased by hemorrhage, diuretics, or vasodilation.
🧷
Beyond optimal preload, further stretching impairs contraction — the descending limb of the Starling curve seen in decompensated heart failure.
🧷
Board distinction: In heart failure, the ventricle operates on a flattened Starling curve where preload changes minimally affect stroke volume.

Afterload and Ejection Dynamics
📍
Afterload is the ventricular wall stress during ejection, clinically approximated by aortic pressure.
📍
LaPlace's law: Wall stress = (Pressure × Radius)/(2 × Wall thickness) — explaining why dilated ventricles face higher afterload.
📍
Increased afterload (hypertension, aortic stenosis) reduces stroke volume and increases end-systolic volume.
📍
Afterload reduction (vasodilators) improves stroke volume, particularly beneficial in heart failure with reduced ejection fraction.
📍
Board pearl: Aortic stenosis creates fixed afterload; systemic hypertension creates variable afterload responsive to vasodilators.

Contractility and Inotropic State
🔹
Contractility is the intrinsic ability of cardiac muscle to generate force independent of preload and afterload.
🔹
Positive inotropes (catecholamines, digoxin, calcium) shift the Starling curve upward and the ESPVR leftward.
🔹
Negative inotropes (beta-blockers, calcium channel blockers, ischemia) shift curves downward and rightward.
🔹
Increased contractility increases stroke volume and ejection fraction while decreasing end-systolic volume.
🔹
Board clue: Unlike preload and afterload changes, altered contractility changes the slope of the end-systolic pressure-volume relationship.

Lusitropy and Diastolic Function
⭐
Lusitropy refers to the rate and extent of ventricular relaxation, determining diastolic function.
⭐
Normal relaxation is an active, energy-dependent process requiring calcium reuptake into the sarcoplasmic reticulum via SERCA2a.
⭐
Impaired relaxation (negative lusitropy) occurs with ischemia, hypertrophy, aging, and hypothyroidism.
⭐
Diastolic dysfunction manifests as elevated filling pressures despite normal systolic function — heart failure with preserved ejection fraction (HFpEF).
⭐
Board pearl: Beta-agonists and phosphodiesterase inhibitors improve lusitropy; ischemia and hypertrophy impair it.

Exercise and the Cardiac Cycle
✅
Exercise increases heart rate primarily by shortening diastole, maintaining systolic ejection time.
✅
Stroke volume increases through enhanced preload (muscle pump), increased contractility (sympathetic stimulation), and decreased afterload (skeletal muscle vasodilation).
✅
Cardiac output can increase 4–6 fold: from 5 L/min at rest to 20–30 L/min during maximal exercise.
✅
The atrial kick becomes increasingly important at high heart rates, contributing up to 40% of ventricular filling.
✅
Board distinction: Trained athletes achieve high cardiac output through increased stroke volume; untrained individuals rely more on heart rate elevation.

Pathologic Changes in Pressure-Volume Relationships
🧠
Systolic dysfunction: rightward shift of loops with decreased EF and increased end-systolic volume.
🧠
Diastolic dysfunction: upward shift of EDPVR with normal EF but elevated filling pressures.
🧠
Mitral regurgitation: increased loop width with low effective forward stroke volume.
🧠
Aortic stenosis: increased peak systolic pressure with narrow pulse pressure.
🧠
Dilated cardiomyopathy: rightward shift with spherical remodeling increasing wall stress.
🧠
Board pearl: Restrictive cardiomyopathy shows steep EDPVR slope; dilated cardiomyopathy shows shallow ESPVR slope.

Clinical Measurements and Normal Values
⚡
Left ventricular end-diastolic pressure (LVEDP): 4–12 mmHg
⚡
Left ventricular systolic pressure: 120 mmHg
⚡
Left atrial pressure: 2–12 mmHg (mean 8 mmHg)
⚡
Ejection fraction: ≥55%
⚡
End-diastolic volume: 120 mL; End-systolic volume: 50 mL; Stroke volume: 70 mL
⚡
Board pearl: Pulmonary capillary wedge pressure approximates left atrial pressure; central venous pressure approximates right atrial pressure.

Integration with ECG Events
📌
P wave occurs during late diastole, preceding atrial systole by 80–100 ms.
📌
QRS complex precedes ventricular contraction by 40–50 ms (electromechanical delay).
📌
Isovolumetric contraction spans from QRS end to T wave beginning.
📌
T wave occurs during ejection, representing ventricular repolarization.
📌
Isovolumetric relaxation begins near T wave end.
📌
Board clue: AV dissociation eliminates the atrial kick, reducing cardiac output even with normal ventricular rate.

Board Question Stem Patterns
📣
Pressure tracing with absent a waves → atrial fibrillation eliminating atrial systole.
📣
Giant v waves on atrial tracing → tricuspid or mitral regurgitation during systole.
📣
Steep y descent after v wave → restrictive physiology with rapid early filling.
📣
Square root sign in ventricular pressure → constrictive pericarditis or restrictive cardiomyopathy.
📣
Pulsus paradoxus with respiratory variation → pericardial tamponade.
📣
Fixed S2 splitting → ASD with fixed right heart volume overload.
📣
Decreased pulse pressure with decreased stroke volume → aortic stenosis or cardiogenic shock.

One-Line Recap
🔸
The cardiac cycle progresses through four phases — isovolumetric contraction (all valves closed, pressure rising), ejection (semilunar valves open), isovolumetric relaxation (all valves closed, pressure falling), and filling (AV valves open) — with valve events determined by pressure gradients and clinical pathology altering these pressure-volume relationships in predictable patterns.

bottom of page